Science-browser
Science in the browser - talk and resources. October 2014
Summary
It's 2014 and web browsers aren't just for displaying carefully, or carelessly, styled graphics and text. We can load data into the browser and manipulate it, share it, and admire it. Let's do science in the browser.
This project presents several easy to follow, and copy, examples as a starting point for projects, discussion, or learning. It draws on personal experience of what is required, or useful, to present and share scientific data within and between research teams.
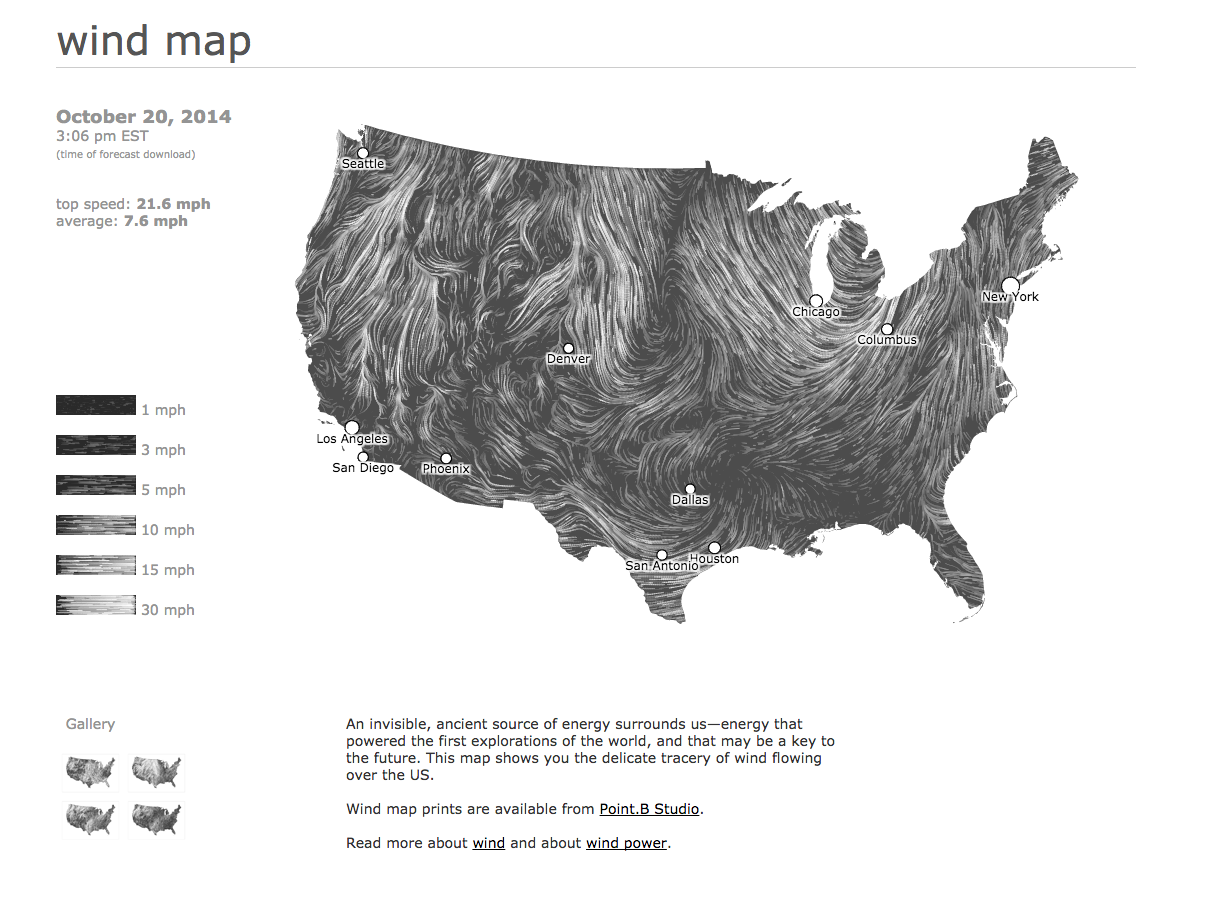
The browser as a surface for diagrams, charts, maps, interactive plots, etc.
These examples show how the browser can transform data into a variety of visual presentations. Drawing in this way, rather than including a pre-rendered PNG doesn't require a lot of Javascript code.
HTML5 canvas
This first example presents the HTML5 canvas element as a surface for directly rendering data. No javascript libraries are required to plot data on the canvas.
What this isn't, is an example of how best to create a gradient fill or a colour scale for a palette. For that see -
D3.js (and Dimple)
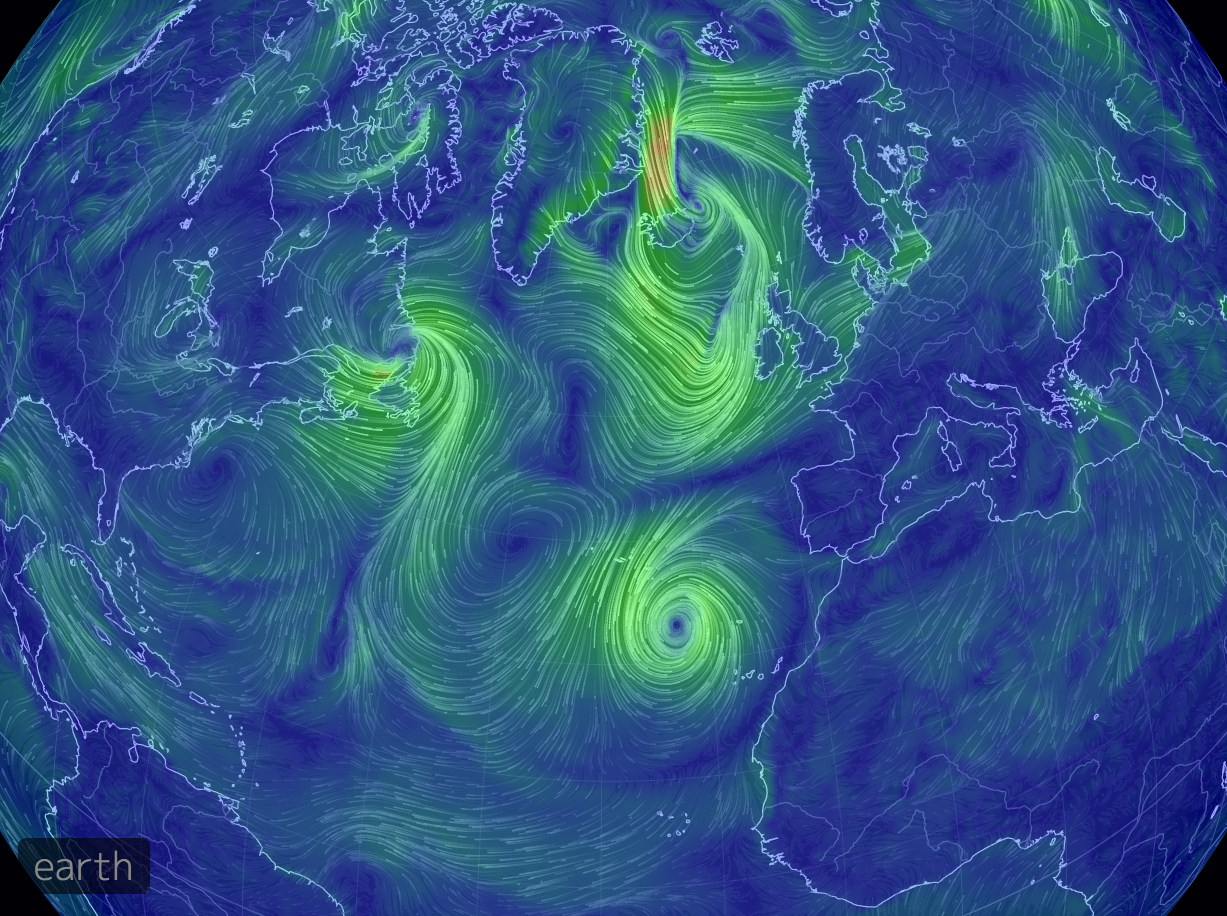
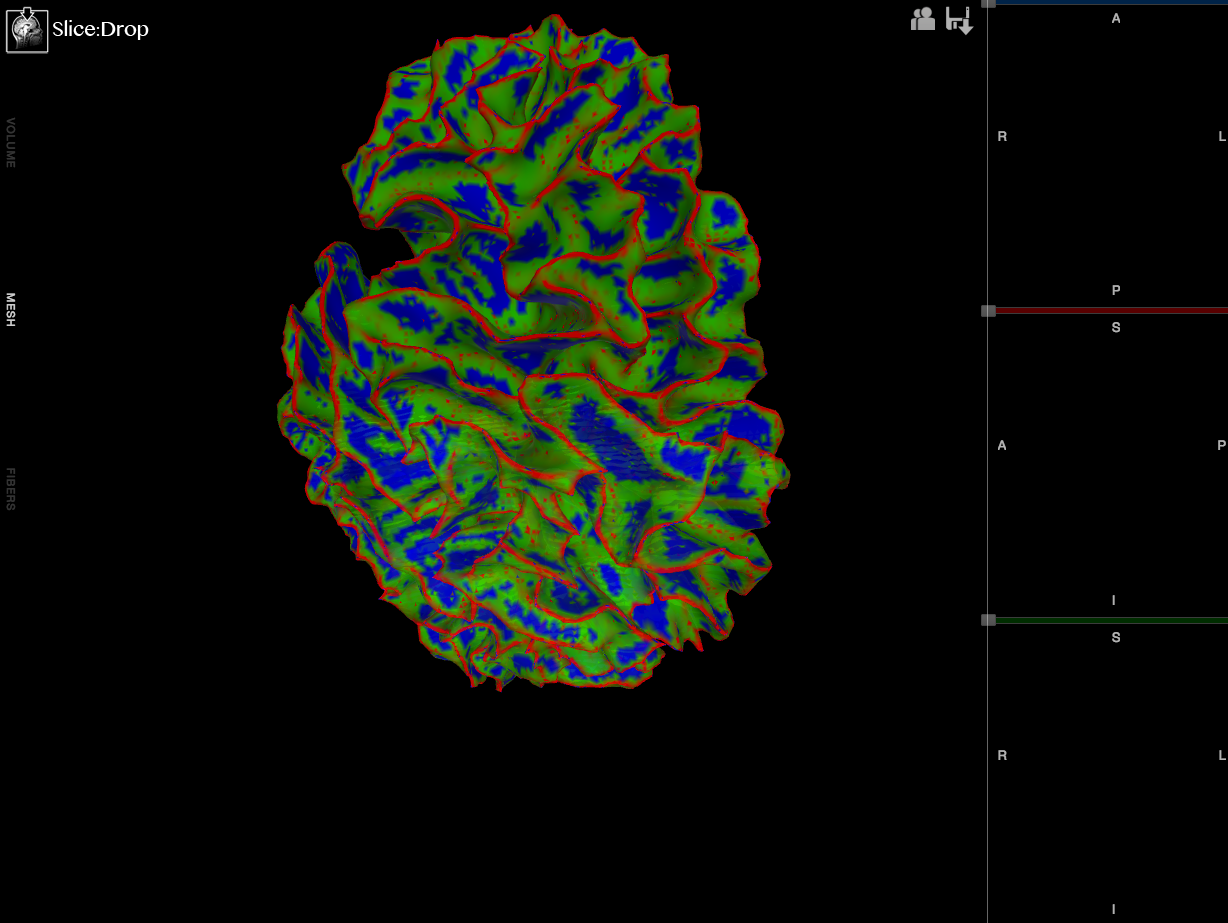
WebGL for high performance 3D (using Threejs)
For 3D graphics the location of the camera, and perhaps even lighting and textures, needs consideration. There's more setting up, but some data is presented much more naturally in this form.
Fetching data
All (usable) browsers provide an XMLHttpRequest object for fetching files from the web server. However it's always going to be necessary to deal with likely errors, the asynchronous nature of such requests and doing useful things with the returned data. For this reason just about everyone uses a cross-platform library such as JQuery or Angularjs.
Angularjs
Weather data example
Fetch json data files and render with Threejs
Collaboration
Science requires collaboration within and between teams. It takes many forms, for example sharing datasets in Dropbox or video conferencing.
Togetherjs
Mozilla Lab's TogetherJS adds impressive collaboration features to webpages with very little extra code.
Resources
Javascript Libraries
The libraries used in the above examples.
Personal projects
These are all work in progress, and were started before the examples above. By stumbling through these projects, and others, I realised simplified demos might help construct new tools.
Gallery
What others are doing. Loads of inspiration here -
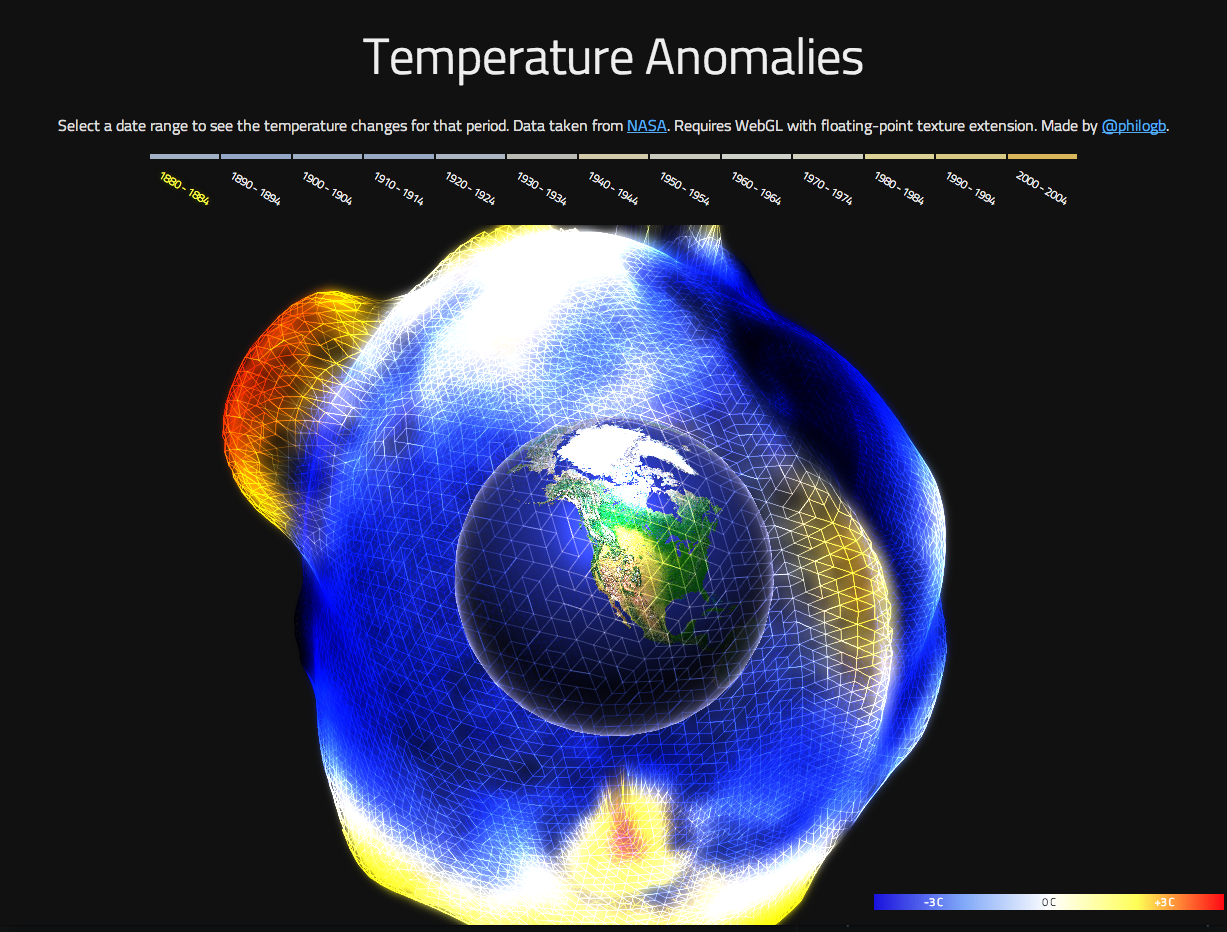
http://philogb.github.io/page/temperature-anomalies/
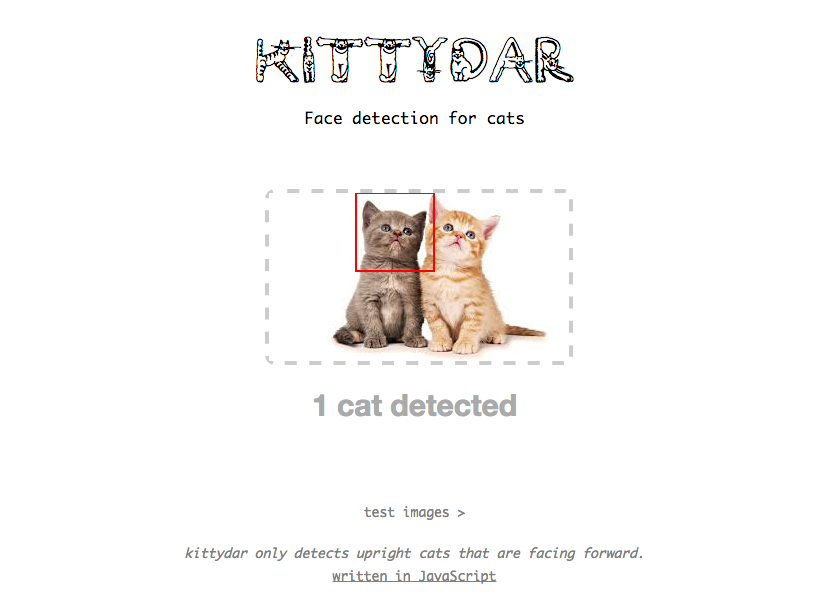
http://harthur.github.io/kittydar/
Tutorials and learning resources
Authors and Contributors
Project started by @msaunby